Property Market

UK Property Market Weekly Update for the ending Sunday, 24th November 2024, (week 47)

  • Listings (New properties coming on to the market)  – 27.2 UK listings this week (week 47), an expected slight drop of 1.8k from last week. 8.3% higher 2024 YTD than 2023 YTD.
  • % of Resi Sales Stock being reduced (Monthly): 13% of Resi sales stock was reduced in the last month. 14% last month and long term 5 year average 10.6%.
  • Total Gross Sales – 23.8k UK homes sold stc this week (Week 47), 1.2% lower than last week.  21% higher than the same standalone week (week 47) in 2023. Also, 8.6% higher than 2017/18/19 YTD levels & 15.1% higher than 2023 YTD levels.
  • Sale Thru rate (Monthly): UK Estate Agents sold 16.11% of their Resi sales stock in Oct ’24. Sept ‘ 24 was 14.79%. 2024 average is 15.86% & the 7 year long term average is 17.9% per month – yet don’t forget that was only in  mid/late 20%’s in the crazy years of 20/21/22).
  • Sale fall-throughs – Agents lost 5.8% of their sales pipeline for the month of October (up from 5.6% in Sept ‘ 24). For the week 47, Sale Fall Thrus (as a % of Gross sales Agreed) decreased 25%). The 7 year Long Term weekly Average is 24.8% and it was 40%+ in the two months following the Truss Budget in the Autumn of 2022.
  • Net Sales – 17.8k this week (average for last 4 weeks 17.7k). 20% higher than the same week 47 in 2023, 56% higher than the same week 47 in 2022 & still 17.4% higher YTD in 2024 compared to YTD 2023.
  • % of Homes exchanging vs homes unsold – Of the 1,387,069 UK homes that left UK Estate Agents books since the 1st Jan 2024, 743,269 of them (53.59%) exchanged & completed contracts (meaning the homeowner moved and the estate agent got paid). The remaining 643,800 (46.41%) were withdrawn off the market, unsold. In essence you a flip of the coin chance of actually selling, homeowners moving and the estate agent getting paid.
  • UK House Prices – As explained in the show, the £/sqft figure foretells and predicts the Land Registry 5 months in advance with an accuracy rating of 92%. Final October figures saw a slight jump in this important metric to £346/sq.ft. For comparison – Sept’s £339/sq.ft, August’s £338/sq.ft, and July at £341/sq.ft. This means house prices are slightly growing.
  • Resi Sales Stock on the Market (Monthly Stat) : 725k at end of October (up from 724k at end of Sept). For comparison, Oct ’23 – 664k, Oct ’22 – 523k,  Oct ’21 – 425k, Oct ’20 – 681k, Oct ’19 – 652k
  • Resi Sales Sold STC Pipeline (Units) (Monthly Stat): 505k at end of October. For comparison, Oct ’23 – 401k, Oct ’22 – 483k,  Oct ’21 – 528k, Oct ’20 – 548k, Oct ’19 – 372k

If you would like to chat about our local property market, feel free to drop’s a line on01245 835859 or email us on paul.curtis@charlesdavidcasson.co.uk

Value my property today

Lets get started! Our valuations are based on our extensive knowledge of the whole of the market.

Get a valuation

Related articles

Blog

How Long Does a Property Spend on the Market in Chelmsford?

When browsing property portals (Rightmove, Zoopla or On…
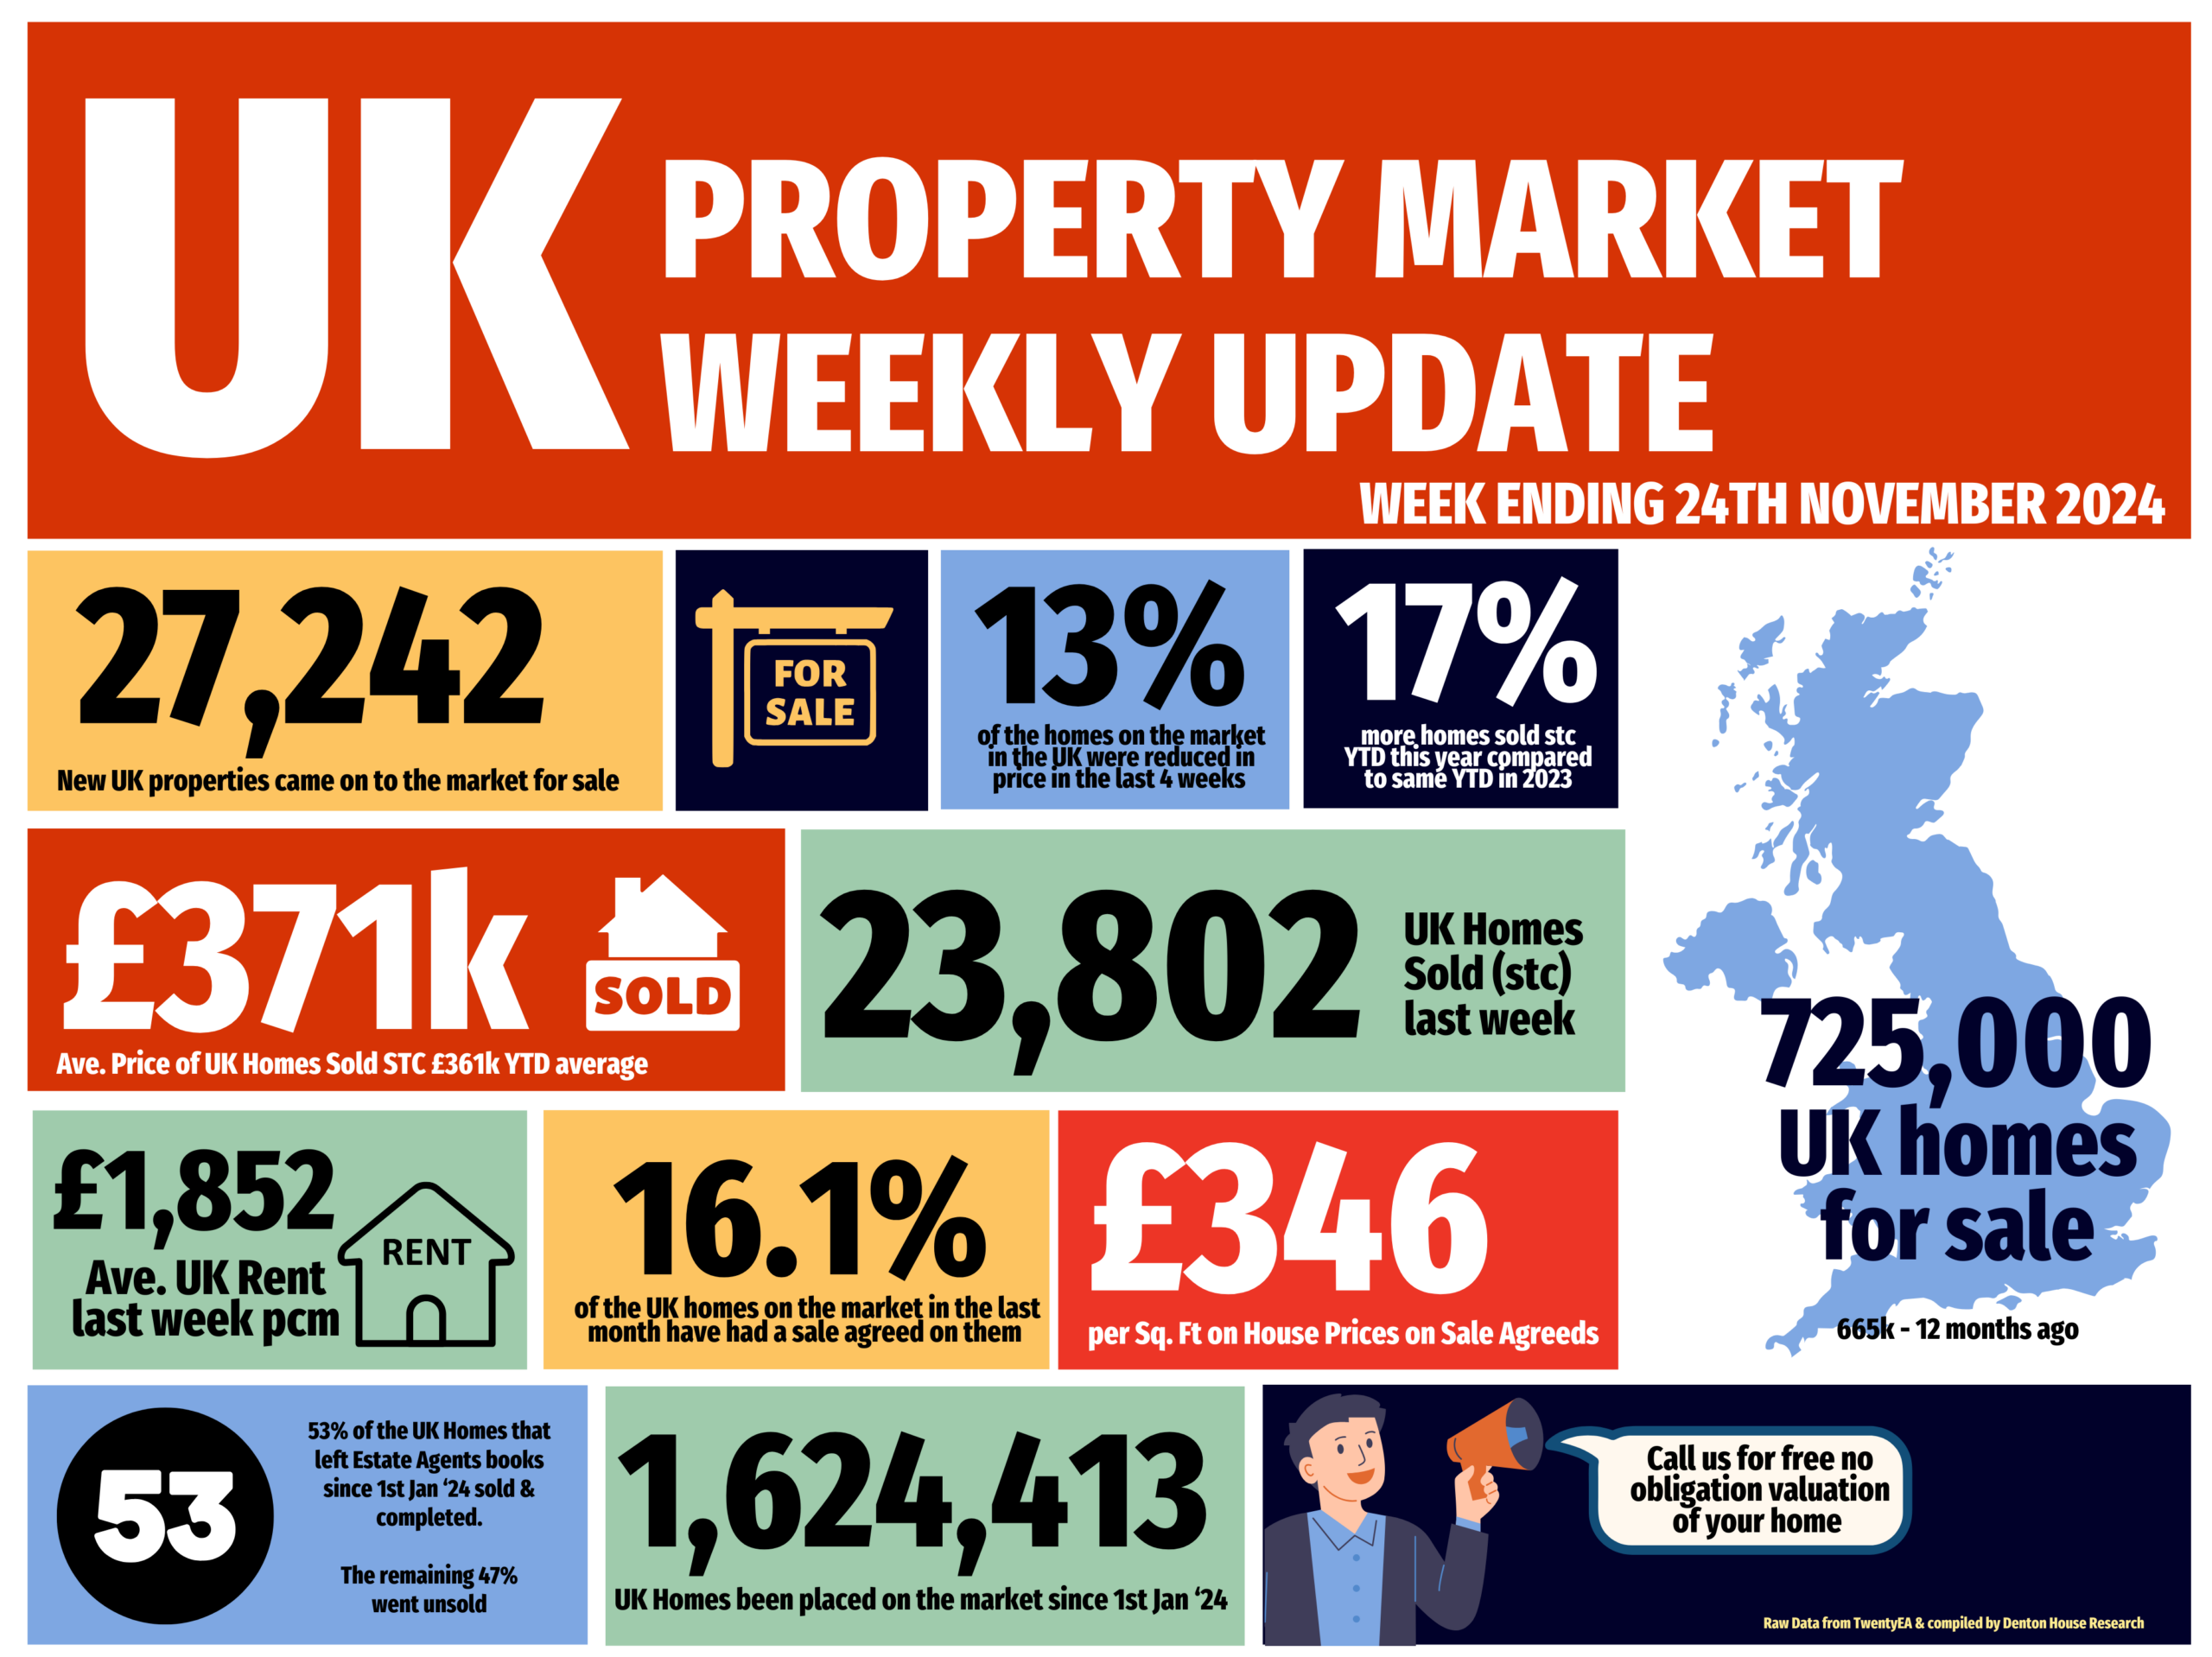
Don’t Rush to Buy in Queens Park NW6 Before the Stamp Duty Changes – Here’s Why Property Market

Don’t Rush to Buy in Queens Park NW6 Before the Stamp Duty Changes – Here’s Why

Don’t Rush to Buy Before the Stamp Duty Changes – H…

2025 Predictions for the UK property market Property Market

2025 Predictions for the UK property market

As we step into 2025, the UK property market faces a pi…